Vibrations and sound
Vibrations and sound
The following text is used only for teaching, research, scholarship, educational use and informative purpose following the fair use principles.
We thank the authors of the texts and the source web site that give us the opportunity to share their knowledge
Physics
Vibrations and sound
We know from the last chapter that sound is a wave motion. We know this because sound undergoes
- Reflection (echoes)
- Diffraction (you can hear around corners)
- Refraction (Explains why sometimes we don’t hear thunder from far away lightning* )
- Interference (see next demonstration)
To demonstrate Interference of sound
Method 1: Using a Signal Generator and Loudspeakers
- Walking slowly from X to Y, you will notice the loudness of the sound increasing and decreasing at regular intervals.
- This is because sound waves from the two speakers will interfere both constructively and destructively, along the path XY.
NB: You must make reference to a signal generator or sound from each speaker having the same frequency.
Method 2: Using a Tuning Fork
- Place a vibrating tuning fork beside your ear and rotate it.
- Again, the loudness of the sound will increase and decrease at regular intervals, this time due to interference between the compressions and rarefractions, as the legs of the tuning fork moves in and out.
Note 1: You don’t have to understand why this works.
Note 2: Either demonstration is acceptable for exam purposes.
To show that Sound needs a medium to travel through*
- Set up the Bell-Jar – the bell can be heard ringing.
- Remove the air from the Bell-Jar using a vacuum pump.
- Result: While the bell can still be seen to be ringing, the sound gets quieter until eventually nothing can be heard*.
Natural Frequency
The Natural Frequency of an object is the frequency at which the object will vibrate if free to do so.
Although it seems weird, every object has its own natural frequency, although some objects will also vibrate at multiples of this natural frequency.
Factors which determine the Natural Frequency of a Stretched String.
- Frequency is inversely proportional to the length of the string: f µ 1/L,
- Frequency is directly proportional to the square root of the tension in the string; f µ ÖT,
- Frequency is inversely proportional to the square root of the mass per unit length of the string; f µ 1/Öµ .
µ (pronounced “meu”) represents ‘mass per unit length’ and is a bit like saying ‘the density of the string material’)
Putting these together, and letting the proportional constant = ½ (just because it is!) we get
Resonance*
Resonance is the transfer of energy so that a body vibrates at its natural frequency.
![]()
![]()
To Demonstrate Resonance


 Use two identical tuning forks and a sound-board.

 Start one fork vibrating, place it on the sound-board and notice the sound.
- Place the second tuning fork on the sound-board and then stop the first tuning fork from vibrating.
- The second fork can now be heard.
Explanation
The vibrations were passed from the first tuning fork via the sound-board to the second tuning fork.
Examples of Resonance: Washing Machines at a particular speed, Microwave Ovens.
The Frequency Limits of Audibility are the highest and lowest frequencies that can be heard by a normal human ear.
The range is 20 Hz – 20,000 Hz.
Sound Intensity
Sound Intensity is defined as power per unit area.
![]()
The unit of Sound Intensity is therefore the Watt per metre squared (Wm-2)
Given that the sound-wave expands equally in all directions (like a spherical balloon being blown up) then it follows that the area it is passing through is the surface area of a sphere: Area = 4πr2.
Threshold of Hearing* is the smallest sound intensity detectable by the average human ear at a frequency of 1KHz.
Its value is 1 x 10-12 Wm-2.
Sound Intensity Level
Human hearing falls roughly in the range 10![]() W m-2 (the Threshold of Hearing) to 1 W m-2 (the loudest, called the Threshold of Feeling)
W m-2 (the Threshold of Hearing) to 1 W m-2 (the loudest, called the Threshold of Feeling)
The size of this range is enormous and is very impractical.
We therefore use a different set of numbers which basically compact the Sound Intensity scale.
These numbers are called Sound Intensity levels and are measured in Decibels (dB)
Examples of Sound Intensity Level
Whisper = 20 dB |
iPod at max volume = 100 dB |
Threshold of Pain = 130 dB |
Perforation of Eardrum = 160 dB |
Note: Doubling the Sound Intensity increases the Sound Intensity Level by 3dB.
Decibel Adjusted dB(A) Scale
The decibel adjusted scale is used because it is adapted to the ear’s frequency response*.
The ear is most sensitive to frequencies between 2000 Hz and 4000 Hz and the Decibel Adjusted scale takes this into account.
The sound-level meter used by environmental engineers has a decibel adjusted scale.
Speed of Sound in different media*
In general, the speed of sound of sound in a solid is greater than in a liquid, which in turn is greater than that for a gas.
The speed of sound in air (at a temperature of 20 0C) is 343 m s-1.
Harmonics
Frequencies which are integer multiples of the fundamental frequency f are called harmonics.
The basic frequency is called the fundamental frequency or first harmonic, 2f is the second harmonic etc.
Overtones
Frequencies which are multiples of a given frequency are called overtones.
If f is the first frequency, then 2f is its first overtone; 3f is its second overtone etc.
Characteristics of Notes
1. Loudness: The loudness of a note depends upon the amplitude of the sound wave*.
2. Pitch: The pitch of a note depends upon the frequency of the sound wave
3. Quality: The quality of a note depends upon the number of overtones present in the note and the relative strengths of those different overtones.*
This explains why a middle C note sounds different when played on different musical instruments.
Acoustics may be defined as the science of sound
Reduction of noise using destructive interference
Noise can be reduced using destructive interference eg in jackhammers. Electronic microchips produce mirror-image wave patterns of the sound. This is fed to headphones, so to cancel out the loud noise for the operator, while enabling him to still hear co-workers voices!
Mandatory Experiments:
- Measurement of the speed of sound in air.
- Investigation of the variation of fundamental frequency of a stretched string with length.
- Investigation of the variation of fundamental frequency of a stretched string with tension.
That’s all folks!
Leaving Cert Physics Syllabus
Content |
Depth of Treatment |
Activities |
STS |
|
|
|
|
1. Wave nature of sound |
Reflection, refraction, diffraction, interference |
Demonstration of interference, e.g. two loudspeakers and a signal generator. |
Acoustics. |
|
|
|
|
2. Characteristics of notes |
Amplitude and loudness, frequency and pitch, quality and overtones. |
|
Dog Whistle |
|
|
|
|
3. Resonance |
Natural frequency. Fundamental frequency. |
Demonstration using tuning forks or other suitable method. |
Vocal cords (folds) |
|
|
|
|
4. Vibrations in strings and pipes |
Stationary waves in strings and pipes. Relationship between frequency and length. |
Use string and wind instruments, e.g. guitar, tin whistle. Appropriate calculations. |
String section and woodwind section in orchestras. |
|
|
|
|
5. Sound intensity level |
Sound intensity: definition and unit. |
Use of sound-level meter. |
Examples of sound-level meter. |
|
|
|
|
Experiments: |
|||
 for a stretched string.
TO MEASURE THE SPEED OF SOUND IN AIR
APPARATUS
Graduated cylinder, resonance tube open at both ends, tuning forks of known frequency, metre stick, digital callipers
DIAGRAM

PROCEDURE
- Set up the apparatus as shown in the diagram
- Strike one of the tuning forks on a block of wood and hold it over the resonance tube.
- Move the inner-tube slowly until the first loud resonant sound is heard.
- Measure the distance from the top of the resonance tube to the top of the water (l ). This is approximately one quarter of the wavelength.
- Measure the inner-diameter of the resonance tube (d) using the digital callipers.
- Note the frequency of the tuning fork; this corresponds to the frequency of the vibrating air column in the resonance tube.
- The wavelength of sound is calculated using the formula: c = 4f (l+0.3d)
- Repeat the procedure with tuning forks of different frequencies. Tabulate the results and get an average value for the speed of sound in air.
RESULTS
Frequency (Hz) |
Length |
c = f (4l) |
diameter d (m) |
0.3 d |
(l+0.3d) |
c = 4f(l+0.3d) |
|
|
|
|
|
|
|
|
|
|
|
|
|
|
Caverage =
CONCLUSION
We got an average value for the speed of sound to be 300 m s-1, which compares none too favourably with the theoretical answer of 343 m s-1. But given that the answer is temperature dependent, it may well be the case that we did our experiment perfectly, but just happened to be a corner of the lab which was at -50 0C.
PRECAUTIONS
- Ensure that your eye is level with the top of the tube when measuring the length to avoid parallax error.
- Start with the inner tube fully in the water and slowly raise it so that you don’t get a harmonic by mistake.
- Repeat your efforts to find the loudest resonance position for each tuning fork. Take the average of the attempts.
So where does the formula c = 4f(l+0.3d) come from?
From our notes we know that for a standing wave the length from node to anti-node is one quarter of the wavelength.
Þ Length from node to anti-node is = l/4
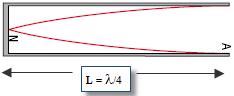
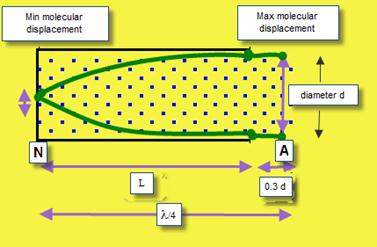
Now it’s not at all obvious from this diagram that the wave shape is merely a mathematical representation of the relative size of the disturbance of the air molecules, but that’s what it is. On the left hand side (the node) there is almost no disturbance, while on the right hand side (the anti-node) there is maximum disturbance.
Now this is all fine in theory, but in practice we have a 3-dimensional tube, and it turns out that the maximum displacement of the air molecules is not just at the top of the pipe, but a little outside it. This extra distance is approximately 0.3 times the diameter. Exactly why it’s 0.3 is beyond the scope of this discussion (which is another way of saying I have no idea). I guess it just is. At any rate that would be the engineering response.
In Physics we try to go for the underlying explanation; Engineers really just don’t care. That is why physicists have nothing but contempt for engineers and everything they stand for. So it doesn’t really seem fair that for every student of mine who goes on to study Physics in college, ten go on to do Engineering - a fact which continues to haunt me every day of my life.
But I digress . . .
In this case that means
(Length of tube plus correction term) = l/4
Þ l = 4 (Length of tube plus correction term)
Þ l = 4 (l + 0.3d)
Now we know c = fl
Þ c = f [4 (l + 0.3d)]
Þ c = 4f (l + 0.3d)
That you should have to remember this formula is nothing short of ridiculous. In no way does it enhance your understanding of the concepts involved. Not only that, but there a number of other ways to do this experiment that never need to use this formula and the syllabus specifically says that any method will do for exam purposes. But then in 2006 (Question 3) they asked a question that related specifically to this method, even going to far as to give the diameter of the tube, so you had to know this formula. Not very nice.
Important lesson on how to be a good scientist: CHEAT !!!
We can ignore the small correction term in order to give us a rough idea of what L should be:
c = f l Þ c = f (4L ) Þ 340 = 4(f)(L) Þ L = 340 / 4 (f)
Now check this each time before you put a value for L into your table.
(Technically we refer to this as ‘checking in advance’; a carpenter would use the phrase “measure twice, cut once”).
INVESTIGATION OF THE VARIATION OF FUNDAMENTAL FREQUENCY OF A STRETCHED STRING WITH LENGTH
APPARATUS: Sonometer, newton-meter, tension key, signal generator, u-magnet
DIAGRAM
PROCEDURE
- Set up as shown on the diagram.
- Fix the tension at a constant value.
- Place the bridges as far apart as possible and measure the length of the wire l between the bridges with a metre stick.
- Slowly increase the applied a.c. frequency from 0 Hz until the paper-rider vibrates the most.
- Note the value of this (fundamental frequency) and the length of the wire.
- Repeat this procedure for different lengths of wire by varying the distance between the bridges.
- Record the measurements in a table.
- Plot a graph of frequency f against 1/length.
RESULTS
f (Hz) |
|
|
|
|
|
|
|
|
l (m) |
|
|
|
|
|
|
|
|
1/l (m-1) |
|
|
|
|
|
|
|
|
CONCLUSION
We obtained a straight line through the origin which verifies that frequency is inversely proportional to the length.
PRECAUTIONS / SOURCES OF ERROR
- Determining exactly where the resonance point is can be tricky so for each length repeat a few times and get an average.
- Avoid parallax errors when using a metre stick to measure the length of the wire.
NOTES
- The Signal Generator
Instead of using the signal-generator and U-magnet, you could just use a tuning fork to generate a vibration of a set frequency (set it vibrating and then stand it either on the sonometer or on one of the bridges). You then vary the position of the second bridge until you reach resonance. In theory this is simpler; in practice it is much more difficult to detect the resonance position because the string doesn’t vibrate sufficiently.
You may find the Signal Generator cutting out quite often if you have the current (Ampllitude setting) up quite high, so if you need a high current just use at that setting for as briefly as possible).
If you do go with the signal generator in the exam, you must remember to include the magnet also.
Exactly why this method works is conveniently ignored for now. But we do go into the theory in Chapter 27: Current in a Magnetic Field.
- The paper rider
If a paper rider is used to locate resonance, place it mid-way between the bridges.
Keep the paper rider as light as possible. Use a small piece of cellotape to hold the paper in the form of a loop.
A short length of drinking straw can also be used as a very light rider. This rider can be moved along the string to detect the positions of nodes and antinodes when the string is vibrating at resonance.
- Instead of using a newton-metre and a tension-control key you could use weights which hang off of one end.
- Wear safety goggles in case the sonometer wire snaps and you lose an eye. Because as everybody knows, it’s all fun and games until someone loses an eye. Then the tears will start . . .
INVESTIGATION OF THE VARIATION OF FUNDAMENTAL FREQUENCY OF A STRETCHED STRING WITH TENSION
APPARATUS
Sonometer, newton-meter, tension key, signal generator, u-magnet
DIAGRAM

PROCEDURE
- Set up as shown on the diagram.
- Fix the length at a constant value.
- Set the tension to a low value.
- Slowly increase the applied a.c. frequency from 0 Hz until the paper-rider vibrates the most.
- Note the value of this frequency and the tension on the wire.
- Repeat this procedure for different tensions by varying the tension-control key.
- Record the measurements in a table.
- Plot a graph of frequency f against the square root of tension.
RESULTS
f (Hz) |
|
|
|
|
|
|
|
T (N) |
|
|
|
|
|
|
|
ÖT (N1/2) |
|
|
|
|
|
|
|
CONCLUSION
A straight line through the origin will verify that frequency is proportional to the square root of tension.
PRECAUTIONS / SOURCES OF ERROR
Determining exactly where the resonance point is can be tricky so for each tension repeat a few times and get an average.
Extra Credit
*Refraction (Explains why sometimes we don’t hear thunder from far away lightning)
Different layers of air are at different temperatures, and sound travels at different speeds in the different layers (quicker in warmer air which is closer to the ground), as a result the sound wave bends away from the ground).
*Sound needs a medium to travel through
Astronauts cannot speak to each other on the moon without the aid of radio waves because of the lack of air.
In one film, when the microphones broke down, the two astronauts put their helmets together, thus transmitting the sound vibrations through the helmets. Sometimes, in popular science fiction films, we see and hear an explosion in space which is incorrect as the sound waves, unlike light, cannot travel through empty space.
*While the bell can still be seen to be ringing, the sound gets quieter until eventually nothing can be heard.
In practice a little sound can still be heard – why?
Partly because it isn’t a complete vacuum and partly because the electrical leads conduct some sound to the outside.
Actually the main reason that the sound decreases in this demo is not because sound can’t travel in a vacuum (although this is indeed true), but rather due to a very different concept called Impedance Mismatch.
*Resonance – What a wonderful concept!
Resonance is one of my favourite topics in Physics.
It explains such a wide range of different phenomena, from a swing pushed at its natural frequency to offering a possible explanation for the collapse of the Walls of Jericho, to tuning in radios.
Tacoma Narrows Bridge Collapse
Washington ; The wind produced an oscillating resultant force in resonance with a frequency equal to a natural frequency of the bridge, causing it to vibrate with such large amplitude oscillations that it completely collapsed.
Cooling towers and factory chimneys can also be set oscillating by the wind at their natural frequencies.
Vibrations in Washing Machines
Washing machines may vibrate violently at particular speeds because resonance occurs when the frequency of the rotating drum equals a natural frequency of the body of the machine. There are usually several natural frequencies at which resonance can occur. Some machines have a block of concrete attached to the outer drum and the consequent increase in mass reduces the amplitude of any vibrations that might build up during washing or spinning.
Microwave ovens
Water molecules have their own natural frequency, which just happens to be in the microwave range. This means that if you 'shine' microwave radiation at water (or food containing water), the individual water molecules will vibrate ('jiggle') at greater amplitudes.
Rattling Windows
Passing vehicles producing vibrations matching the natural frequency of a window in a nearby building can cause the windows to resonate.
*… at a frequency of 1,000 Hz.
Why do we have to specify a frequency?
Because just like we are more receptive to some electromagnetic frequencies than others, we are also more receptive to some sound frequencies. The human ear is very sensitive at the 1,000 Hz point.
See also the note on the decibel adjusted scale.
*The decibel adjusted scale dB(A) is used because it is adapted to the ear’s frequency response.
A sound gets louder if the sound intensity increases.
However it can get a lot more complicated; if the frequency were adjusted while the sound intensity remained constant, we would also think that the sound had gotten louder (or quieter), even though a machine would detect no increase in loudness.
This is because we are more sensitive to some frequencies than others.
So instead of just measuring decibels, we must also bear in mind the frequency involved; the units used to indicate this new quantity are decibel adjusted (dBA).
A baby’s cry contains frequencies corresponding to the most sensitive part of the human ear’s frequency range (we are most sensitive to sounds between 2000 Hz and 4000Hz)This means that sounds at these frequencies seem louder than sounds at other frequencies. This is because the natural frequency of the main bone in the ear is about 3kHz.
*The speed of sound of sound in a solid is greater than in a liquid, which in turn is greater than that for a gas
Remember the Cowboys in the Westerns listening for the sound of an on-coming train by putting their ear to the rail-track?
*The loudness of a note depends upon the amplitude of the sound wave
Loudness also depends upon the sensitivity of the listener; we are more sensitive to some frequencies than others – see the dBA.
*Harmonics and Overtones
The concept of overtones is usually used in conjunction with musical instruments, which emit a number of multiples all at the same time, whereas harmonics may refer to just a single multiple being sounded at a given time.
It’s just a guess.
Harmonics in a pipe open at one end Harmonics in a pipe open at both ends
![]()
*Quality
The quality of a note depends upon the number of overtones present in the note
It also depends upon the relative strengths of the different overtones present.
In practice, when a musical instrument emits a given note (corresponding to a certain frequency), it will also emit a number of overtones, but at lower strengths.
Different instruments emit different combinations of overtones, and at different strengths.
Exam questions
- [2006 OL]
- The speed of sound depends on the medium through which the sound is travelling.
Explain how sound travels through a medium.
- Why is the speed of sound greater in water than in air?
- [2006 OL][2008 OL]
Describe an experiment to demonstrate that sound requires a medium to travel.
- [2008 OL]
The diagram shows a signal generator connected to two loudspeakers emitting the same note.
A person walks slowly along the line AB.
- What will the person notice?
- Why does this effect occur?
- What does this tell us about sound?
- [2005 OL]
- In an experiment, a signal generator was connected to two loudspeakers, as shown in the diagram. Both speakers are emitting a note of the same frequency and same amplitude.
A person walks along the line XY.
Describe what the person hears.
- What does this experiment demonstrate about the nature of sound?
- [2005][2003]
Describe an experiment to show that sound is a wave motion.
- [2004 OL]
Describe an experiment to demonstrate the interference of sound.
- [2007 OL][2010 OL]
Explain the term natural frequency.
- [2007 OL][2010]
Explain the term resonance.
- [2007 OL][2010][2010 OL]
Describe an experiment to demonstrate resonance.
- [2006]
How does resonance occur in an acoustic guitar?
- [2010 OL]
An opera singer, singing a high pitched note, can shatter a glass. Explain why.
- [2008]
What is the relationship between the frequency of a vibrating stretched string and its length?
- [2006]
What is the relationship between frequency and tension for a stretched string?
- [2005][2004 OL]
The frequency of a stretched string depends on its length.
Give two other factors that affect the frequency of a stretched string.
- [2009 OL][2007 OL][2010][2010 OL]
Name the property on which the pitch of a musical note depends.
- [2007 OL][2010][2010 OL]
State the wave property on which the loudness of a note depends.
- [2010]
State the physical property on which the quality of a note depends.
- [2010]
Explain why a musical tune does not sound the same when played on different instruments.
- [2010]
A mobile phone converts the received radio frequency waves to sound waves.
What are the audible frequency limits for sound waves?
Sound intensity and Sound Intensity Level
- [2007][2002]
Define sound intensity.
- [2004]
The sound intensity doubles as a person approaches a loudspeaker.
What is the increase in the sound intensity level?
- [2009]
The sound intensity level at a concert increases from 85 dB to 94 dB when the concert begins.
By what factor has the sound intensity increased?
- [2007]
- A loudspeaker has a power rating of 25 mW.
What is the sound intensity at a distance of 3 m from the loudspeaker?
- The loudspeaker is replaced by a speaker with a power rating of 50 mW.
What is the change in the sound intensity?
- What is the change in the sound intensity level?
- [2002 OL][2008 OL]
What physical quantity is measured in decibels?
- [2003]
Sound intensity level can be measured in dB or dB(A).
What is the difference between the two scales?
- [2007]
The human ear is more sensitive to certain frequencies of sound.
How is this taken into account when measuring sound intensity levels?
Mandatory Experiments
- [2008 OL]
You carried out an experiment to find the speed of sound in air, in which you measured the frequency and the wavelength of a sound wave.
- With the aid of a diagram describe the adjustments you carried out during the experiment.
- How did you find the frequency of the sound wave?
- How did you measure the wavelength of the sound wave?
- How did you calculate the speed of sound in air?
- Give one precaution you took to get an accurate result.
- [2003 OL]
In an experiment to measure the speed of sound in air, a student found the frequency and the wavelength of a sound wave.
- Draw a labelled diagram of the apparatus used in the experiment.
- Describe how the student found the wavelength of the sound wave.
- How did the student find the frequency of the sound wave?
- How did the student calculate the speed of sound in air?
- Give one precaution that the student took to get an accurate result.
- [2006]
A cylindrical column of air closed at one end and three different tuning forks were used in an experiment to measure the speed of sound in air. A tuning fork of frequency f was set vibrating and held over the column of air.
The length of the column of air was adjusted until it was vibrating at its first harmonic and its length l was then measured. This procedure was repeated for each tuning fork.
f/Hz |
512 |
480 |
426 |
l/cm |
16.0 |
17.2 |
19.4 |
Finally, the diameter of the column of air was measured.
The following data was recorded.
Diameter of column of air = 2.05 cm.
- Describe how the length of the column of air was adjusted.
- Describe how the frequency of the column of air was measured.
- Describe how the diameter of the column of air was measured.
- How was it known that the air column was vibrating at its first harmonic?
- Using all of the data, calculate the speed of sound in air.
- [2006 OL]
A student carried out an experiment to investigate how the fundamental frequency of a stretched string varied with its length. The following is an extract from her report.
I set the string vibrating and adjusted its length until it was vibrating at its fundamental frequency. I then recorded the length of the vibrating string and its fundamental frequency. I repeated this procedure for different lengths of the stretched string.
Finally, I plotted a graph of the fundamental frequency of the vibrating string against the inverse of its length.
- Draw a labelled diagram of the apparatus used in the experiment.
Indicate on your diagram the length of the string that was measured.
- Describe how the student set the string vibrating.
- How did the student know that the string was vibrating at its fundamental frequency?
- Draw a sketch of the graph expected in this experiment.
- [2002 OL)
In a report of an experiment to investigate the variation of fundamental frequency of a stretched string with length, a student wrote the following.
“The wire was set vibrating at a known frequency. The length of the wire was adjusted until it vibrated at its fundamental frequency. The length was recorded. A different frequency was applied to the wire and new measurements were taken. This procedure was repeated a few times.”
- How was the wire set vibrating?
- How was the length adjusted?
The table shows the measurements recorded by the student.
Fundamental frequency (Hz) |
650 |
395 |
290 |
260 |
192 |
174 |
163 |
length/ (m) |
0.20 |
0.33 |
0.45 |
0.50 |
0.66 |
0.75 |
0.80 |
1/length (m-1) |
|
|
|
|
|
|
|
- Copy the table and complete the last row by calculating 1/ length1for each measurement.
- Plot a graph on graph paper of fundamental frequency against 1/ length. Put fundamental frequency on the vertical axis.
- What does the graph tell you about the relationship between fundamental frequency and length?
- [2009 OL]
In an experiment, a student investigated the variation of the fundamental frequency f of a stretched string with its length l. During the experiment the student kept the tension in the string constant. The table shows the data recorded by the student.
f/Hz |
100 |
150 |
200 |
250 |
300 |
350 |
400 |
l/m |
0.50 |
0.33 |
0.25 |
0.20 |
0.166 |
0.142 |
0.125 |
1/l (m− 1) |
|
|
|
|
|
7.04 |
|
- Describe, with the aid of a diagram, how the student obtained the data.
- Why was the tension in the string kept constant during the experiment?
- Copy this table and fill in the last row by calculating 1/l for each measurement.
- Plot a graph on graph paper to show the relationship between the fundamental frequency and the length of the stretched string (put 1/l on the X-axis).
- What does your graph tell you about the relationship between the fundamental frequency of a stretched string and its length?
- [2004]
A student investigated the variation of the fundamental frequency f of a stretched string with its length l.
 Draw a labelled diagram of the apparatus used in this experiment. Indicate on the diagram the points between which the length of the wire was measured.
The student drew a graph, as shown, using the data recorded in the experiment, to illustrate the relationship between the fundamental frequency of the string and its length.
- State this relationship and explain how the graph verifies it.
- The student then investigated the variation of the fundamental frequency f of the stretched string with its tension T. The length was kept constant throughout this investigation.
How was the tension measured?
- What relationship did the student discover?
- Why was it necessary to keep the length constant?
- How did the student know that the string was vibrating at its fundamental frequency?
- [2009]
A student investigated the variation of the fundamental frequency f of a stretched string with its tension T.
The following is an extract of the student’s account of the experiment.
“I fixed the length of the string at 40 cm. I set a tuning fork of frequency 256 Hz vibrating and placed it by the string.
I adjusted the tension of the string until resonance occurred. I recorded the tension in the string. I repeated the experiment using different tuning forks.”
- How was the tension measured?
- How did the student know that resonance occurred?
f /Hz |
256 |
288 |
320 |
341 |
384 |
480 |
512 |
T /N |
2.4 |
3.3 |
3.9 |
4.3 |
5.7 |
8.5 |
9.8 |
The following data were recorded.
- Draw a suitable graph to show the relationship between the fundamental frequency of a stretched string and its tension.
- State this relationship and explain how your graph verifies it.
- Use your graph to estimate the fundamental frequency of the string when its tension is 11 N
- Use your graph to calculate the mass per unit length of the string.
- [2002]
T/N |
15 |
20 |
25 |
30 |
35 |
40 |
45 |
f /Hz |
264 |
304 |
342 |
371 |
402 |
431 |
456 |
A student obtained the following data during an investigation of the variation of the fundamental frequency f of a stretched string with its tension T.
The length of the string was kept constant.
- Describe, with the aid of a diagram, how the student obtained the data.
- Why was the length of the string kept constant during the investigation?
- Plot a suitable graph on graph paper to show the relationship between fundamental frequency and tension for the stretched string.
- From your graph, estimate the tension in the string when its fundamental frequency is 380 Hz.
Exam solutions
- The molecules vibrate and as a result the energy is then passed from particle to particle.
- Because the molecules of water are closer together than are the molecules of air, so the energy can be transferred more quickly.
- Set up the Bell-Jar – the bell can be heard ringing.
- Remove the air from the Bell-Jar using a vacuum pump.
- Result: While the bell can still be seen to be ringing, the sound gets quieter until eventually nothing can be heard.
- The loudness of the sound increases and decreases at regular intervals.
 Because of interference caused from waves coming from the two speakers.
- Sound is a wave.
- The loudness of the sound increases and decreases at regular intervals.
- It demonstrates that sound is a wave.

- Set up as shown
- Walking slowly from X to Y, you will notice the loudness of the sound increasing and decreasing at regular intervals.
- This is because sound waves from the two speakers will interfere both constructively and destructively, along the path XY.
- Same answer as previous question.
- Natural frequency is the frequency at which an object will vibrate if free to do so.
- Resonance is the transfer of energy so that a body vibrates at its natural frequency.

 Use two identical tuning forks and a sound-board.

 Start one fork vibrating, place it on the sound-board and notice the sound.
- Place the second tuning fork on the sound-board and then stop the first tuning fork from vibrating.
- The second fork can now be heard.
- Energy is transferred from the strings to the hollow body and both vibrate at the same frequency.
- Energy is transferred due to resonance because the singer is singing at the natural frequency of the glass.
- Frequency is proportional 1/ length
- Frequency is proportional to the square root of tension.
- Tension and mass per unit length of the string
- Frequency
- Loudness depends on amplitude
- Quality/timbre: harmonics / overtones
- Different instruments emit (a fundamental frequency plus) different (combinations of) overtones/harmonics.
- 20 Hz to 20 000 Hz
- Sound Intensity is defined as power per unit area.
- 3 dB
- If sound intensity doubles Þ intensity level increases by 3 dB, so if intensity has increased by 9 dB then the sound intensity must have increased by a factor of 8.
- Surface area of sphere = 4π r2
S.I at 3 m = (25 × 10-3 ) ÷ 4 π (3)2
S.I = 2.21 × 10⁻⁴ W m-2
- Increased by: 2.21 × 10⁻⁴ W m-2
- Increased by: 0.30 B or 3 dB
- Sound intensity level
- The dB(A) is adjusted so that it is suitable for the human ear.
- By using a sound level meter which is most sensitive to sounds between 2kHz and 4 kHz / just like the ear /dBA / decibel adapted / a frequency weighted scale is used
- We adjusted the length of the inner tube until resonance occurred.
- We read it from the tuning fork which was used to create the sound wave.
- We measured the diameter of the inner tube using digital callipers.
We measured the length of the inner tube above the water.
We then used the formula λ = 4(l + 0.3d) to calculate the wavelength.
- We substituted the values for frequency and wavelength into the formula c = f λ
- Repeat using different tuning forks and take an average, clamp tube to take measurements.

- See diagram.
- We measured the diameter of the inner tube using digital callipers.
We measured the length of the inner tube above the water.
We then used the formula λ = 4(l + 0.3d) to calculate the wavelength.
- We read it from the tuning fork which was used to create the sound wave.
- We substituted the values for frequency and wavelength into the formula c = f λ
- Repeat using different tuning forks and take an average, clamp tube to take measurements.
- The inner pipe was raised while immersed in water.
- The frequency was read from the tuning fork which caused the vibration.
- Using a digital calipers
- The inner tube was raised until a loud sound could be heard.
- v = f λ
λ = 4( l +0.3 d)
v1 = 340(.3) m s-1; v2 = 342(.0) m s-1 ; v3 = 341(.1) m s-1
vavg = 341(.13) m s-1
- See diagram.
- By turning on the signal generator.
- The paper rider starts to vibrate vigorously.
- See diagram.
 Using a signal generator in series with a metal wire which had a magnet around it.
- By moving the position of one of the bridges.
The table shows the measurements recorded by the student.
1/length (m-1) |
5.0 |
3.0 |
2.2 |
2.0 |
1.5 |
1.3 |
1.25 |
- See graph
- The straight line through the origin shows that frequency is inversely proportional to length.
 See diagram
Adjust frequency until the paper rider falls off (resonance occurs)
Record the frequency on the signal generator and measure the length between the bridges.
Adjust the distance between the bridges and repeat.
- Because frequency also depends on tension and you can only investigate the relationship between two variables at a time.
f/Hz |
100 |
150 |
200 |
250 |
300 |
350 |
400 |
l/m |
0.50 |
0.33 |
0.25 |
0.20 |
0.166 |
0.142 |
0.125 |
1/l (m− 1) |
2.00 |
3.03 |
4.00 |
5.00 |
6.02 |
7.04 |
8.00 |
 Fundamental frequency is inversely proportional to length
- See diagram
- f is proportional to 1/l.
A straight line through the origin verifies this.
- Using a newton-balance / pan with weights / suspended weights
- Frequency is proportional to ÖTension.
- Because length is a third variable and you can only investigate the relationship between two variables at a time.
- The paper rider on the string falls off.
- A newton balance // weight of pan + contents
- Paper rider jumped vigorously / the string vibrated at maximum amplitude
- Six correct values for ÖT
- Both axes correctly labelled
- Six points correctly plotted
- Straight line with a good fit
- f is proportional to square root of T because the graph was a straight line through the origin.
 If tension is 11 N Þ ÖT = 3.32
Use the graph to get f = 542 Hz
- Compare the formula on the right to the formula y = mx Þ slope = 1/(2lÖμ), where l = 0.4 m
Mass per unit length (μ) = 5.86 × 10⁻⁵ kg m–1
 Slowly increase the frequency on the signal generator until resonance occurs.
Note the frequency on the signal generator and the tension on the Newton balance.
Change tension and repeat.
- Because length is a third variable and you can only investigate the relationship between two variables at a time.
- Square root of tension / frequency squared
Label axes
Plot 6 points correctly
Straight line
Good fit
- At a frequency of 380 the square root of tension= 5.6 T = 30.3 N
Source : http://www.thephysicsteacher.ie/LC%20Physics/Student%20Notes/17.%20Sound.doc
Web site link: http://www.thephysicsteacher.ie
Author : not indicated on the source document of the above text
If you are the author of the text above and you not agree to share your knowledge for teaching, research, scholarship (for fair use as indicated in the United States copyrigh low) please send us an e-mail and we will remove your text quickly.
Vibrations and sound
Vibrations and sound
Vibrations and sound
This is the right place where find the answers to your questions like :
Who ? What ? When ? Where ? Why ? Which ? How ? What does Vibrations and sound mean ? Which is the meaning of Vibrations and sound?
Vibrations and sound physics notes
Alanpedia.com from 1998 year by year new sites and innovations
Main page - Disclaimer - Contact us